Interpretation of Data


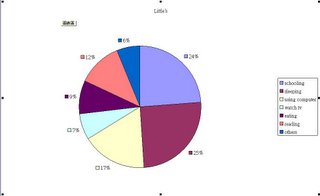
The two pie graphs show the proportional representation of Little's and Eunice's average weekly hour spending on schooling、sleeping、watching TV、using computer、eating、reading、and other things.
As can be seen from the two diagrams、we both spend 24% on schooling of weekly hours. Sleeping also receives most time spending; it is quarter of weekly hours of Little、and it is 20% in Eunice's.
In Eunice's graph、the same percentage of hours is spent on using computer as in sleeping.
The third place of Little's time spending is using computer, which receives 17% of weekly hours.
Reading occupies 12% of Little's and 15% of Eunice's weekly time respectively.
Regarding eating, Little spends 7%、while Eunice spends 5%.
Both of us spend less time on watching TV、only 7% at Little's、5% at Eunice's.

2 Comments:
The two pie graphs show the proportional representation of Little and Eunice in average weekly hours spending on schooling, sleeping, watching TV, using computer, eating, reading, and other things.
-->Little's and Eunice's average weekly hour spending....
In Eunice's graph, the same percentage of hours is spent in using computer as in sleeping.
The third place of Little's time spending is using computer which receives 17% of weekly hours.
-->good
-->spent on...
-->is using computer, which...
Reading of weekly hours spending between Little and Eunice are the scale with 12% and 15%
-->Reading occupies 12% of Little's and 15% of Eunice weekly time respectively.
Regarding eating of weekly hours spending, Little spends 7%, while Eunice spends 5%.
-->Regarding eating, Little spends...
Both of us spend less time on watching TV, only 7% at Little’s, 5% at Eunice's.
The two pie graphs show the proportional representation of Little's and Eunice's average weekly hour spending on schooling、sleeping、watching TV、using computer、eating、reading、and other things.
In Eunice's graph、the same percentage of hours is spent on using computer as in sleeping.
The third place of Little's time spending is using computer、which receives 17% of weekly hours.
Reading occupies 12% of Little's and 15% of Eunice's weekly time respectively.
Regarding eating、Little spends 7%、while Eunice spends 5%.
Post a Comment
<< Home